WORLD HEART REPORT 2023

CONFRONTING THE WORLD'S NUMBER ONE KILLER

Cardiovascular diseases (CVDs) affect the heart or blood vessels and can be caused by a combination of socio-economic, metabolic, behavioural, and environmental risk factors.

These include high blood pressure, unhealthy diet, high cholesterol, diabetes, air pollution, obesity, tobacco use, kidney disease, physical inactivity, harmful use of alcohol and stress.

The data doesn’t lie. This report confirms the serious threat that cardiovascular disease poses all over the world, particularly in low- and middle-income countries.

Up to 80 per cent of premature heart attacks and strokes can be prevented. It’s vital that countries prioritise rolling out tools and policies to protect people from CVD.

Good data can help drive good policy – the opportunity is still there to accelerate action towards reducing premature mortality from NCDs by one-third by 2030.

Professor Fausto Pinto, co-author of the report and former WHF president

global burden of cardiovascular disease (cvd) mortality

CVD is the leading cause of mortality and a major contributor to disability.

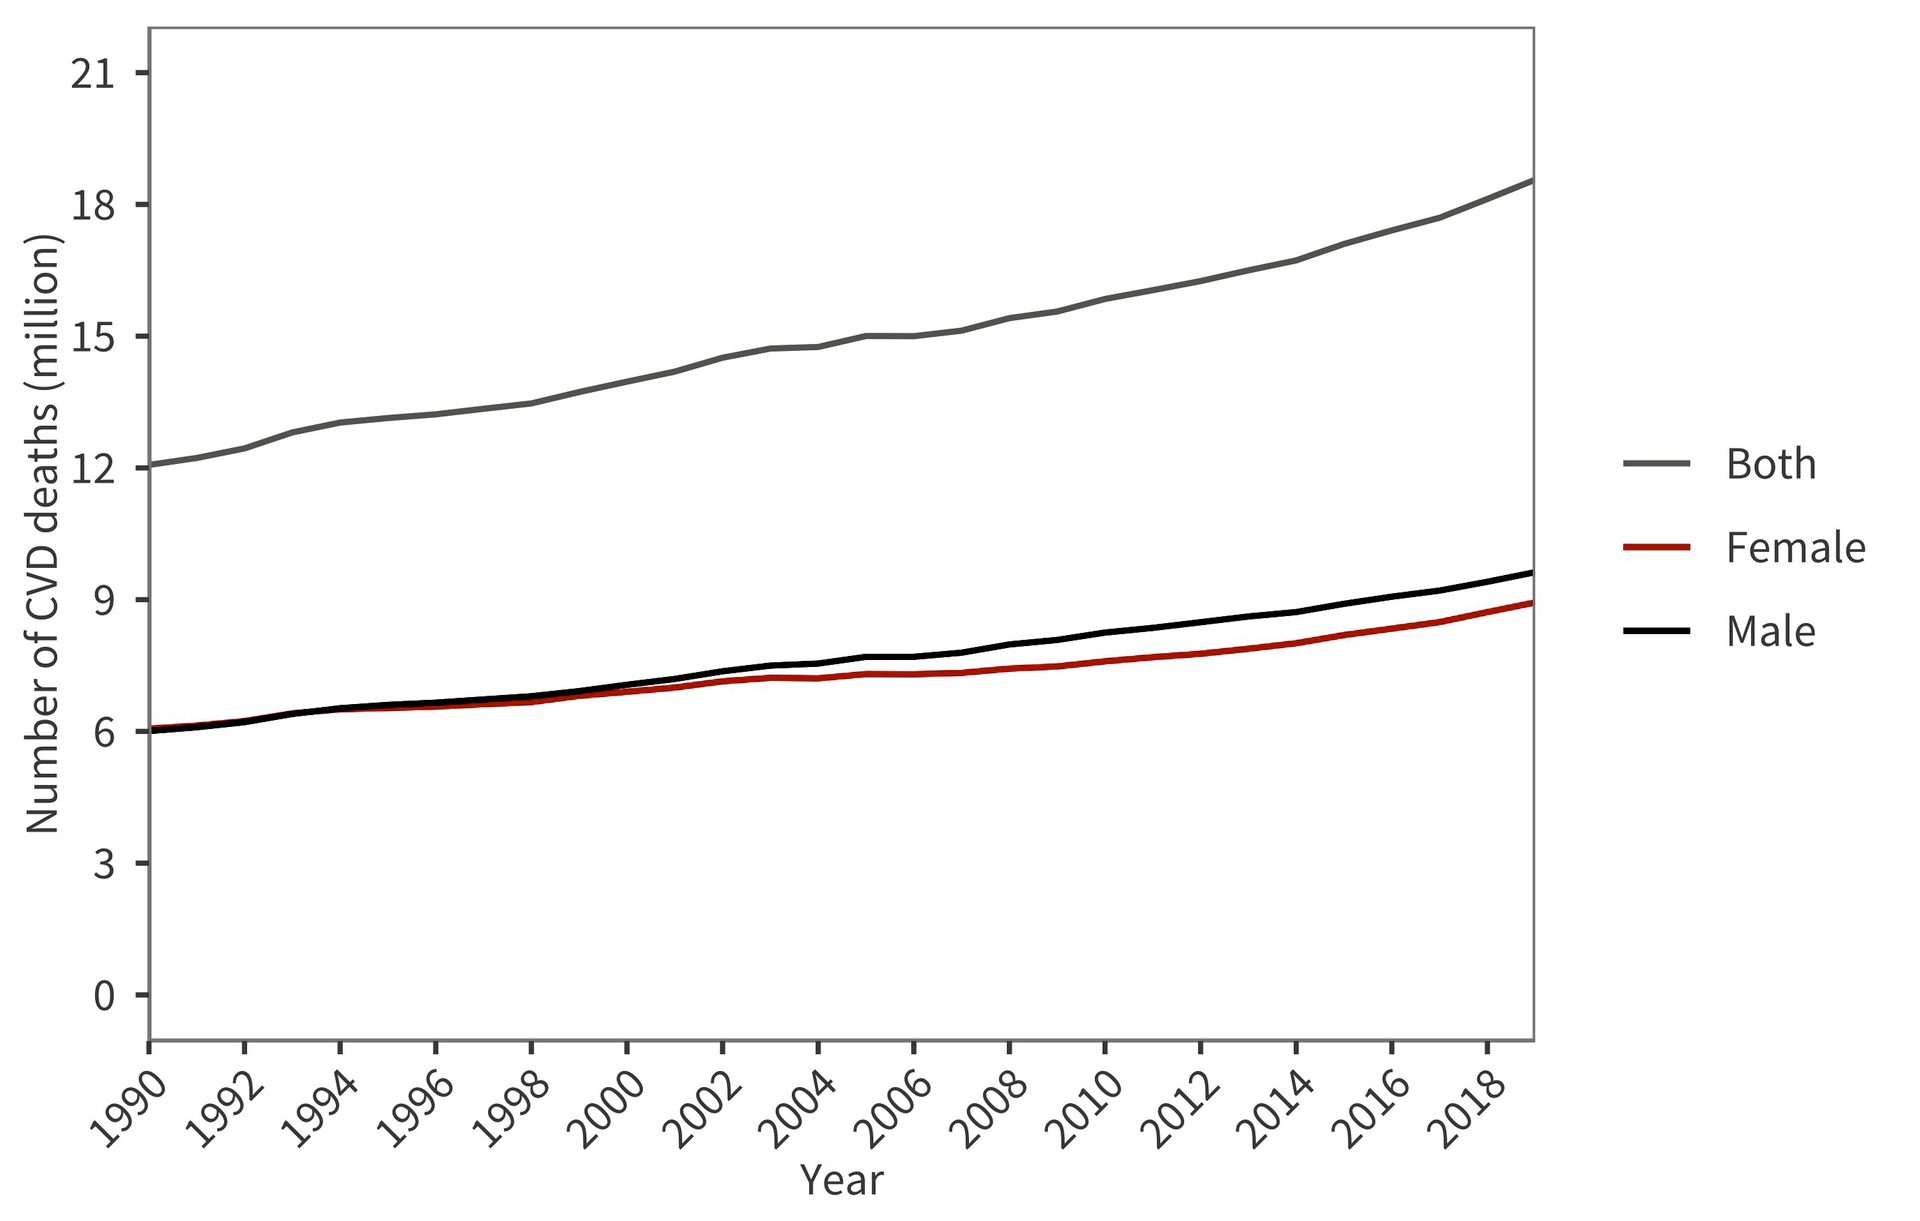
Globally, the estimated number of deaths due to CVDs increased from around 12.1 million in 1990 (equally distributed between males and females) to 18.6 million (9.6 million males and 8.9 million females) in 2019.

Figure 1:
Global trends in number of deaths due to cardiovascular diseases, 1990-2019.

Source: Institute for Health Metrics and Evaluation (IHME). GBD Compare Data Visualization. Seattle, WA: IHME, University of Washington, 2020. Available from http://vizhub.healthdata.org/gbd-compare. (18 March 2023)

Rectangle, Slope, Plot, Line

CVD is the leading cause of mortality and a major contributor to disability.


Globally, the estimated number of deaths due to CVDs increased from around 12.1 million in 1990 (equally distributed between males and females) to 18.6 million (9.6 million males and 8.9 million females) in 2019.

Figure 1:
Global trends in number of deaths due to cardiovascular diseases, 1990-2019.

Source: Institute for Health Metrics and Evaluation (IHME). GBD Compare Data Visualization. Seattle, WA: IHME, University of Washington, 2020. Available from http://vizhub.healthdata.org/gbd-compare. (18 March 2023)

Rectangle, Slope, Plot, Line
some trends and key findings

The number of CVD deaths has risen in the last 30 years but adjusting for a population’s age structure*, the death rate has fallen, more so in high-income countries (HICs) compared to low- and middle-income countries (LMICs), where more than 80% of CVD deaths occur globally.

* Age-standardization is a technique used to better compare disease outcomes, such as death rates, across populations. It calculates what the disease outcome would be if the population age-structure were the same for all countries. This allows an assessment of whether the observed differences are due to factors related to the disease, rather than the age structure of the population.   

Mortality

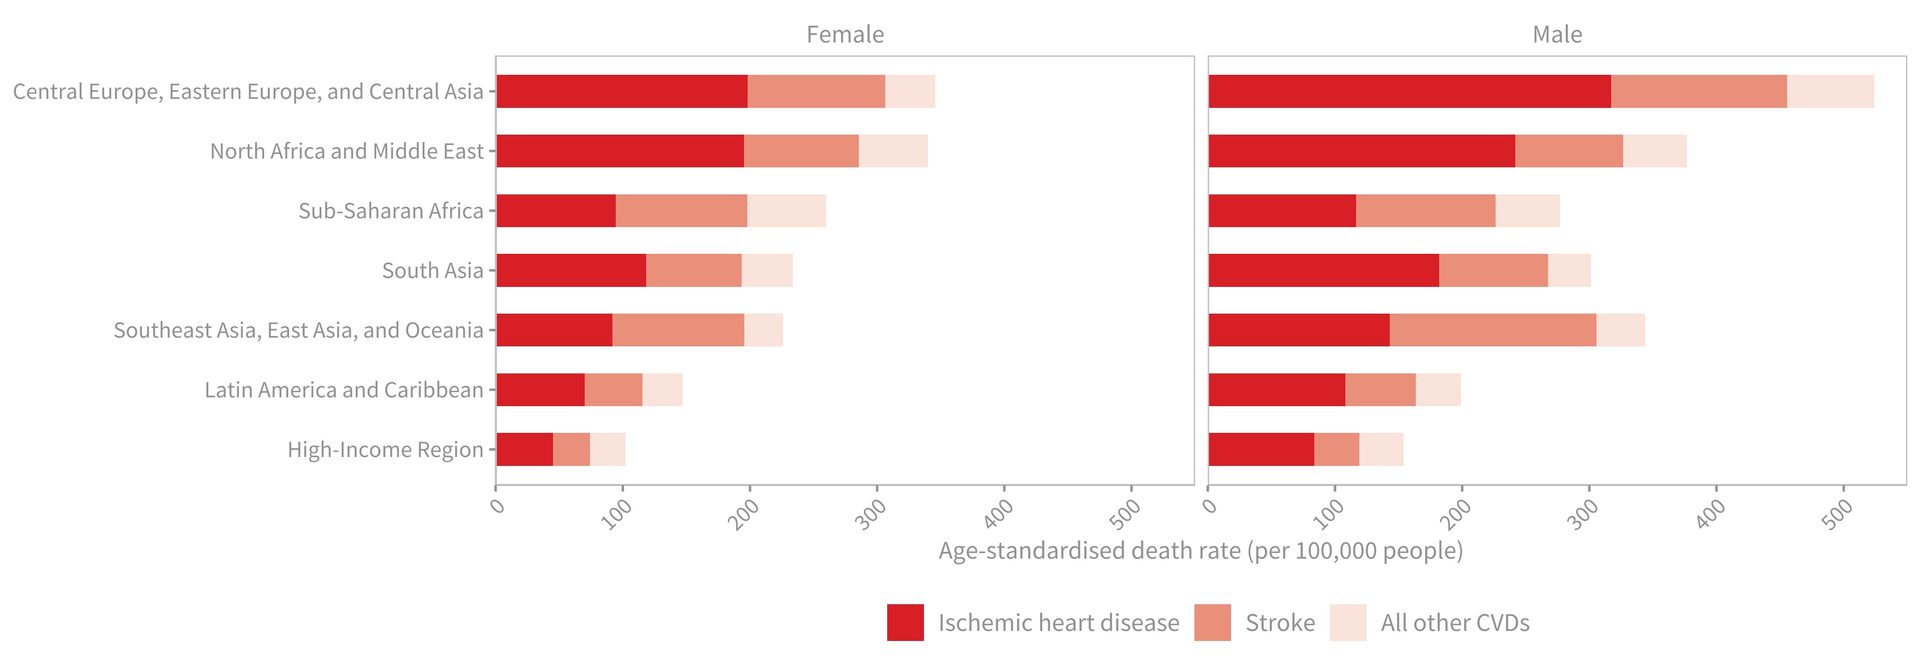
  • The highest levels of age-standardised CVD death rates occur in the Central Europe, Eastern Europe, and Central Asia region and the North-Africa and Middle East region.
  • Ischaemic heart disease is the leading cause of CVD mortality in most regions
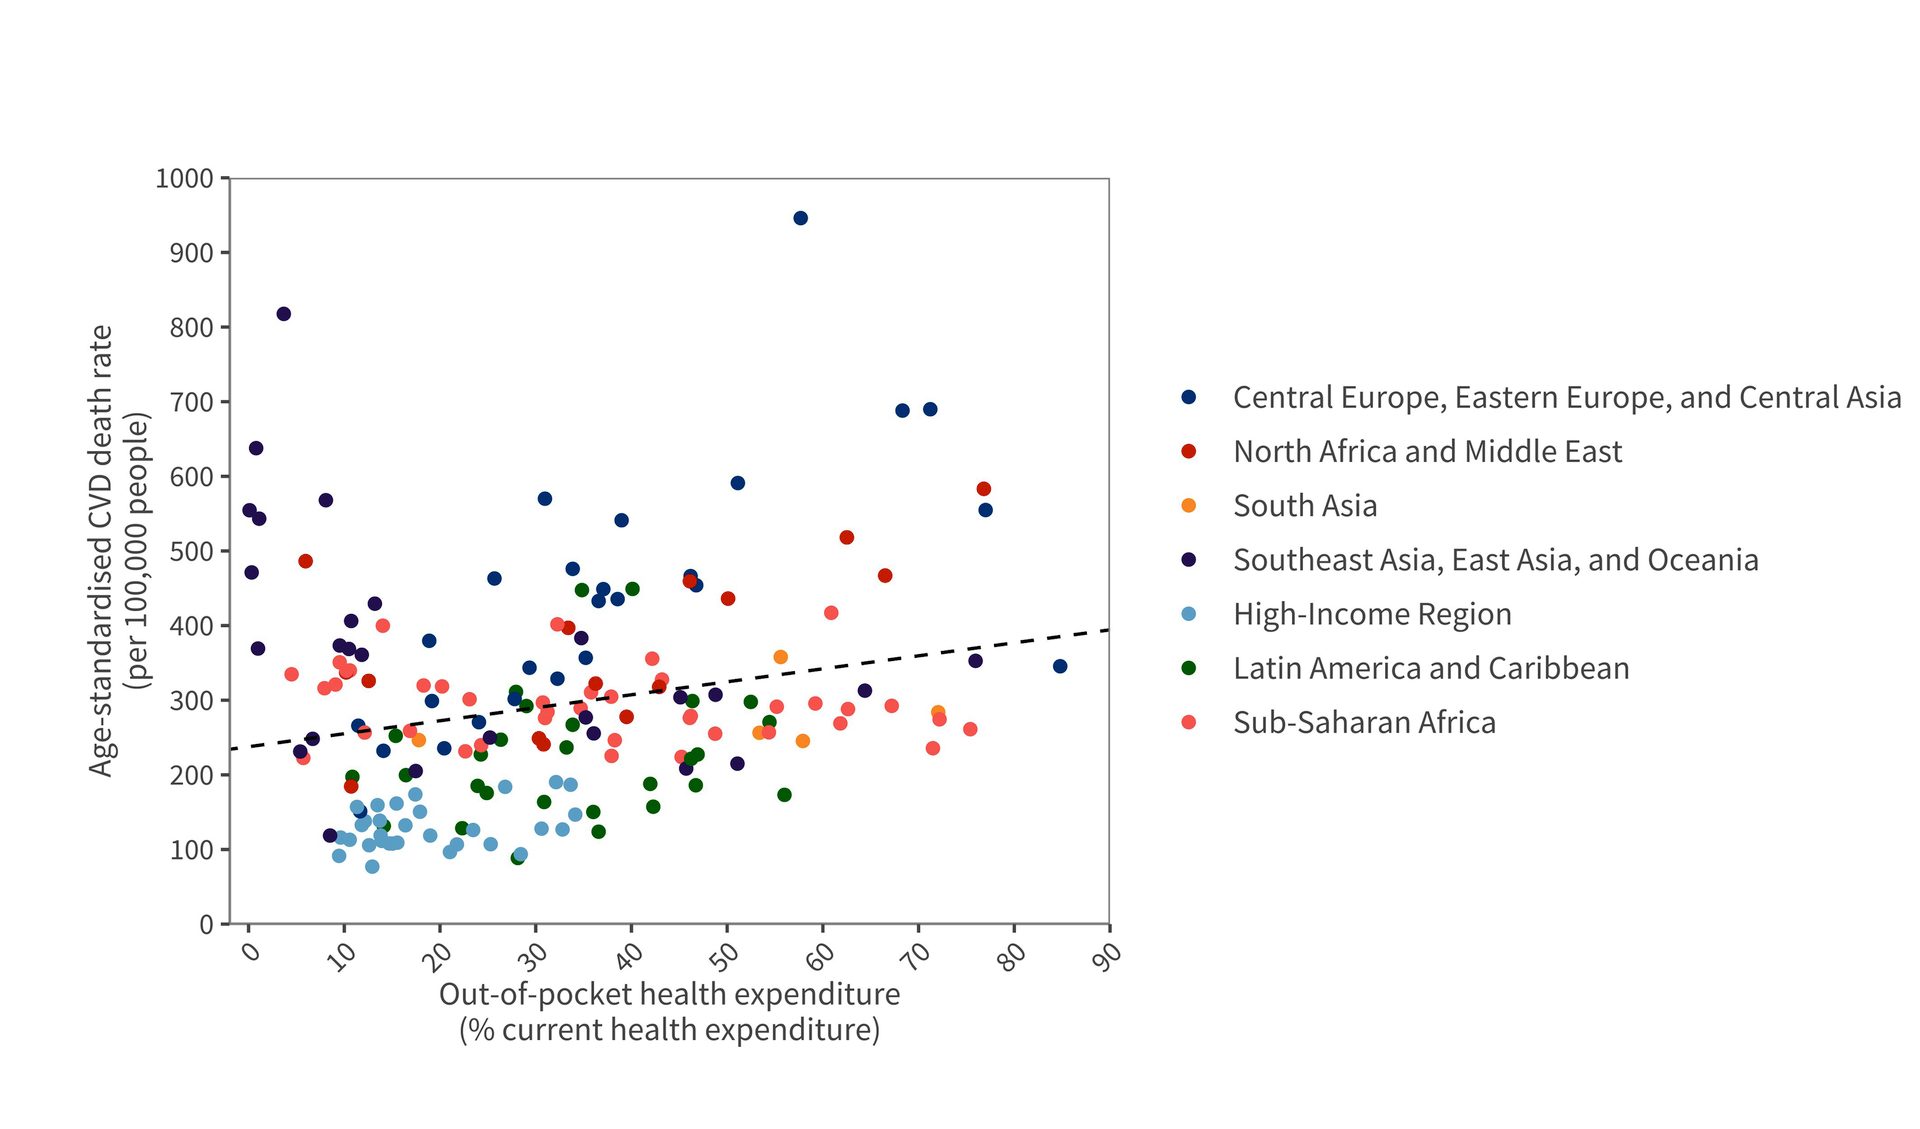
  • There is a correlation between lower expenditure on health as a percentage of GDP and higher CVD mortality. In addition, the higher the proportion of out-of-pocket expenditure for health, the higher the CVD mortality.

risk

  • Most CVD risk factors, including physical inactivity, alcohol consumption, tobacco smoking, raised blood pressure, and diabetes are higher in males in comparison to females. Obesity is the only risk factor that is higher in females.
  • The distribution of CVD risk factors varies markedly by region.
  • The distribution of CVD risk factors varies by sex.
THE WHF Policy Index
  • The WHF Policy Index consists of 8 criteria.
  • The WHF Policy Index showed that the lowest implementation of key policies for improving CVD health is in the Sub-Saharan Africa region, where over 50% of the countries do not have availability of CVD drugs, a CVD National Plan or an NCD Unit.
  • Globally, 106 countries (64% of 166 countries with available information), have implemented at least 7 of the 8 policies.
  • The largest proportion of countries with the maximum score (8) were in the South Asia region (80%), the Central Europe, Eastern Europe, and Central Asia region (68%), and the High-Income (62%) region.
What it is
An analysis of the level to which national governments have implemented eight policies that are critical for CVD health.

Note: The analysis does not correlate to CVD mortality. For example, a country with a high policy score (i.e., it has implemented a number/all the policies to mitigate CVDs) will not necessarily have a low CVD death rate.
What it does
It combines data20 on whether the following policies/measures have been implemented:

1) National tobacco control programmes
2) Action plan for CVDs
3) Operational Unit in Ministry of Health with responsibility for NCDs
4) Guidelines for the management of CVDs
5) Action plan to reduce physical inactivity
6) Action plan to reduce unhealthy diet related to NCDs
7) Action plan to reduce the harmful use of alcohol
8) Availability of CVD drugs (e.g., ACE inhibitors, aspirin, and Beta blockers) in the public health sector.
How it is calculated
For each policy implemented, a score of 1 is assigned. The Index is calculated by adding up each country’s overall score, ranging from 0 (none of the policies are implemented) to 8 (all the polices are implemented). The source of data for each country is the WHO Global Health Observatory.
Why we need it
In the Sub-Saharan Africa region, most countries have higher levels of raised blood pressure. Air pollution levels are also high across the region, and particularly in countries in the Sahel. Generally, countries in southern Sub-Saharan Africa have the highest risk factor levels in the region.

Cardiovascular disease

deaths by gender

In 2019, CVD death rates were higher in males than females in all countries in the High-Income region, the Central Europe, Eastern Europe, and Central Asia region, and the South Asia region.

Females had higher CVD death rates than males in the following:

  • Six of 21 countries in the North Africa and Middle East region, with the highest differences in Qatar (464.6 compared to 301.9 deaths per 100,000 people for females and males respectively), Egypt (600.0 compared to 491.6 deaths per 100,000 people), and Algeria (447.7 compared to 371.5 deaths per 100,000 people).
  • Thirteen of 46 countries in the Sub-Saharan Africa region, with the highest gaps observed in Mali, Mauritania, Congo (Congo-Brazzaville), Ghana, and Sierra Leone.

Cardiovascular disease

deaths by cause

Ischaemic heart disease and stroke are the leading drivers of CVD mortality.

In all regions, ischaemic heart disease is the leading cause of CVD mortality across males and females, except for females in the Sub-Saharan Africa region and both males and females in South Asia where stroke is the leading cause of CVD mortality (Figure 6).


Stroke is on average the second leading cause of CVD mortality across regions.

Figure 6:
Cause-specific regional age-standardised cardiovascular disease death rate, 2019.

Rectangle, Slope, Font

Cardiovascular disease

mortality and health expenditure

Countries that spend more on healthcare as a percentage of GDP have reduced CVD mortality.

Table 1:
Proportion of countries spending at least 5% of GDP on health, 2019

Region

%

97

85

High-Income

Central Europe, Eastern Europe, and Central Asia

Latin America and Caribbean

North Africa and Middle East

Southeast Asia, East Asia, and Oceania

Sub-Saharan Africa

South Asia14

53

50

71

45

0

A positive correlation is observed regarding people’s out-of-pocket
expenditure. In countries where people spend more out-of-pocket on
their healthcare, the CVD death rates are on average higher (Figure 8).

Rectangle, Slope

Figure 8:
– National age-standardised cardiovascular disease death rate (per 100,000 people), 2019, by out-of-pocket (OOP) health expenditure as share of current health expenditure (CHE).

Investing in healthcare saves lives. This evidence is indisputable. In line with WHO recommendations, countries must invest at least 5 per cent of their GDP to help bring down CVD death rates and morbidity.

Professor Mariachiara di Cesare of the Institute of Public Health and Wellbeing at the University of Essex, which compiled and analysed the data in collaboration with WHF.

Cardiovascular disease

premature mortality

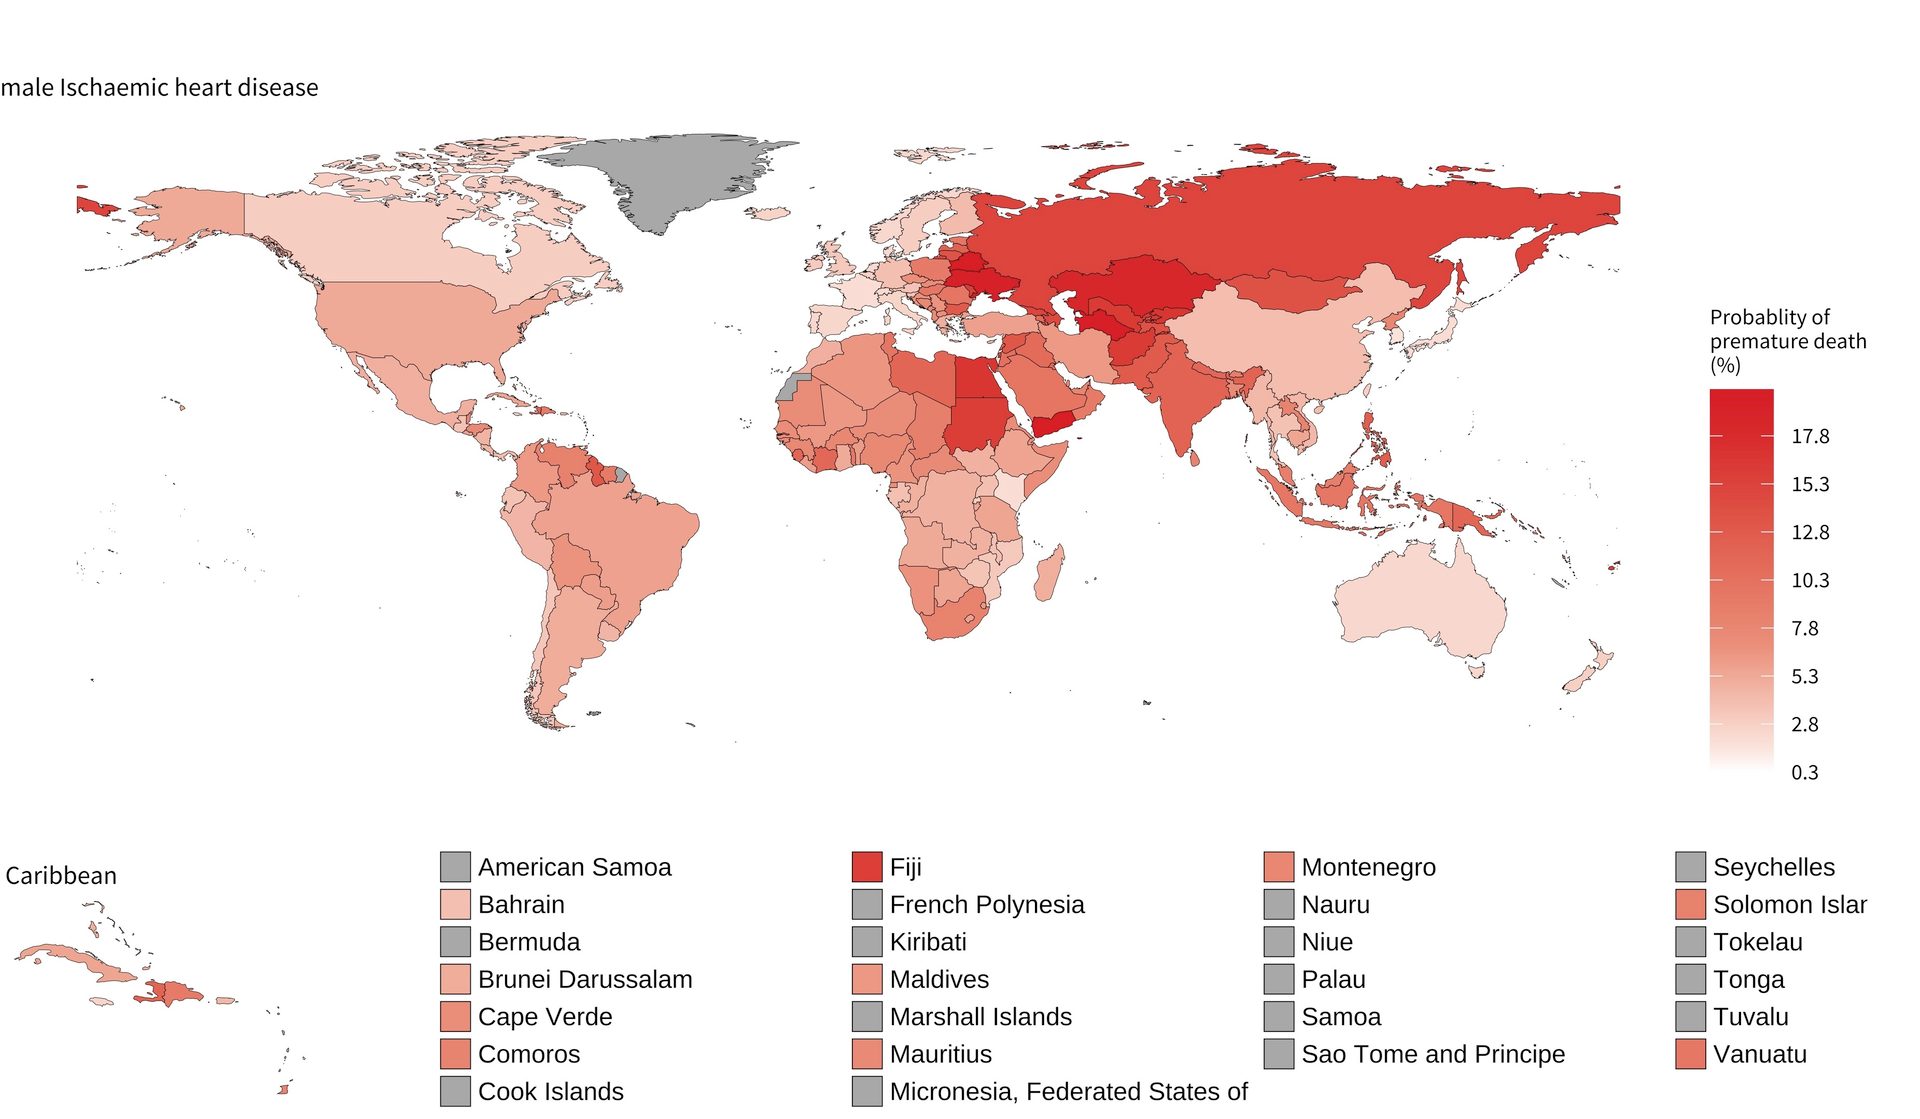
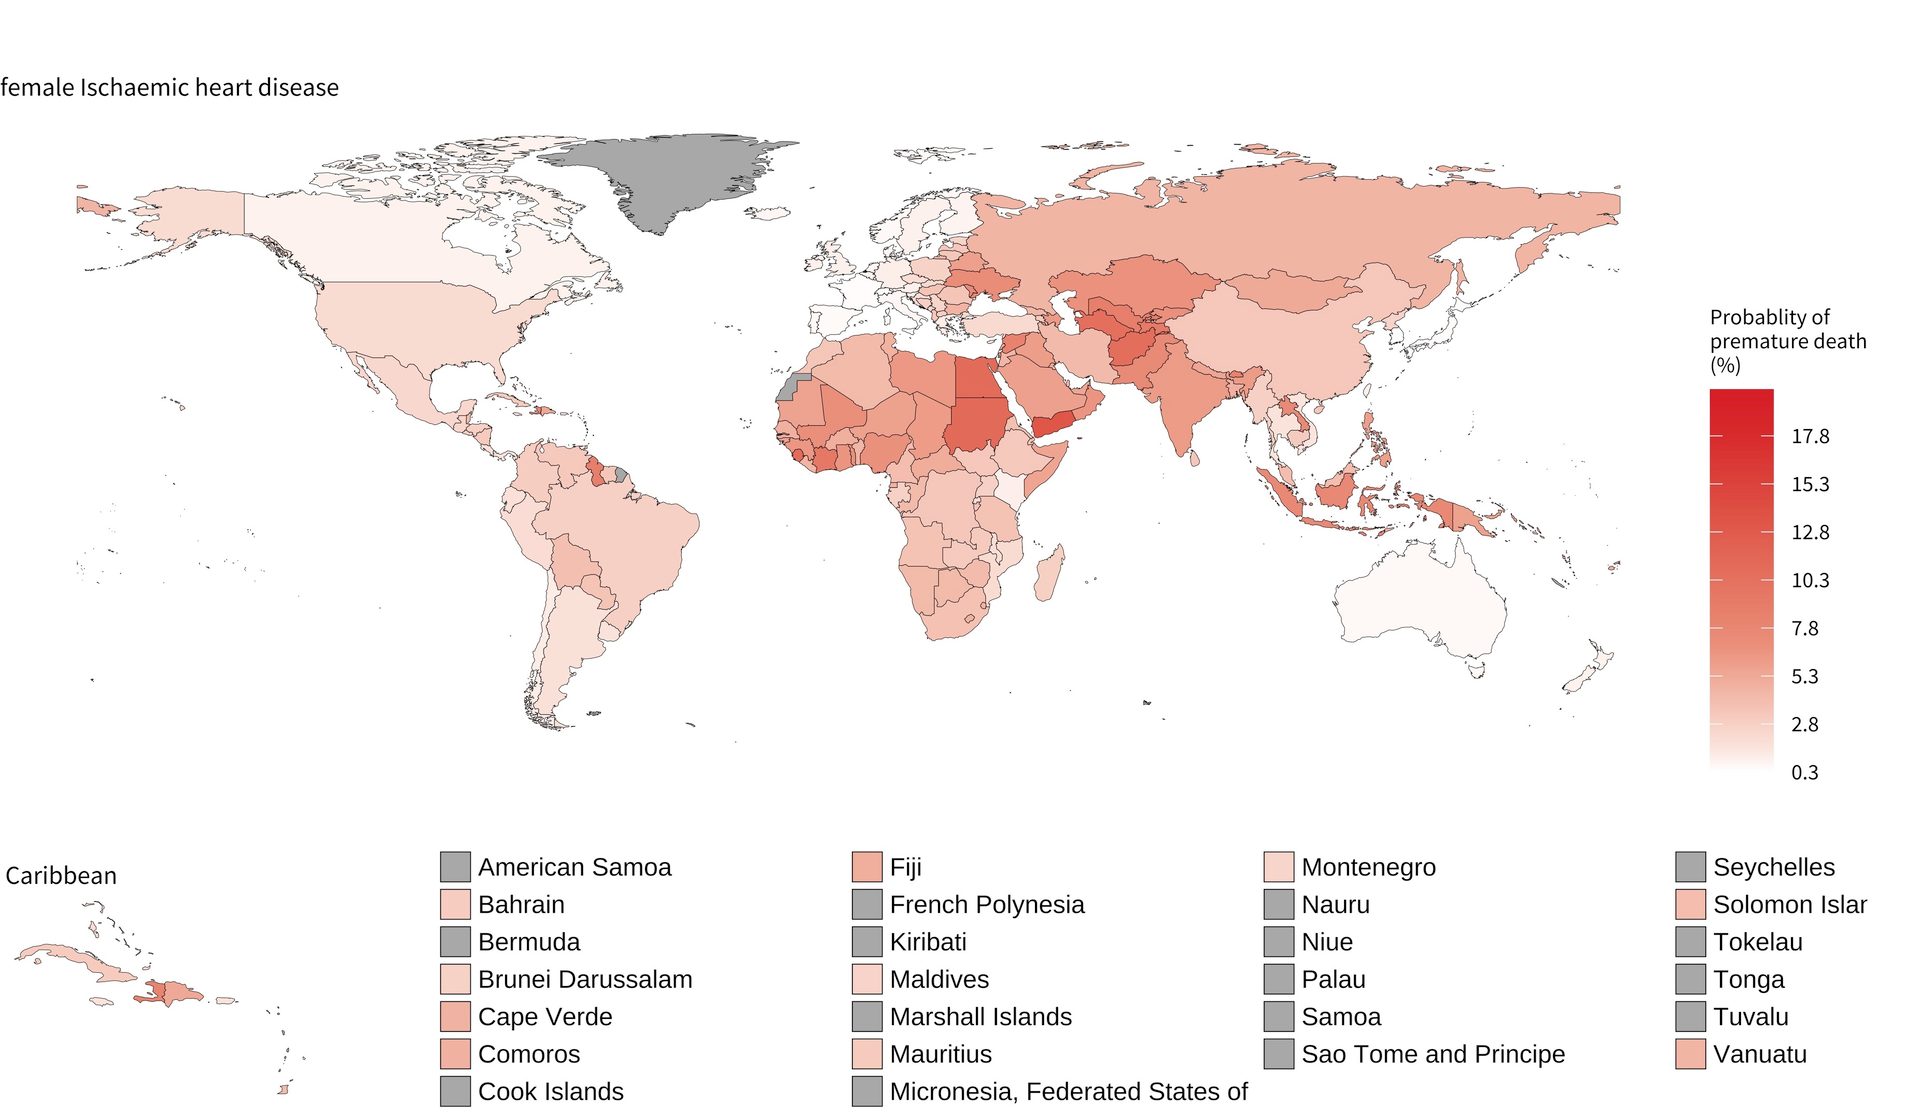
Premature mortality from NCDs refer to deaths between the ages of 30 and 70 years of age.

In addition to the tragedy of this loss of life, these deaths impact societies, and economies more broadly. Overall, 38% of premature deaths from NCDs were caused by CVDs in 201515.

Ischaemic heart disease was the leading cause of premature death among all NCDs in most countries for both men and women.

Ecoregion, Map, World, Font, Red

Figure 9:
Probability of dying prematurely (between 30 and 70 years of age) from ischaemic heart disease, by sex, 2015. Countries and territories without data are shown in grey

Ecoregion, Map, World, Font

Cardiovascular disease risk factors

behavioural, metabolic, environmental

Modifiable risk factors contributing to CVD mortality in 2021:

  • Raised blood pressure (10.8 million deaths)
  • Elevated LDL cholesterol – one type of blood lipid (3.8 million deaths)
  • High fasting plasma glucose (2.3 million deaths)
  • Air pollution (4.8 million deaths)
  • High body-mass index (2 million deaths)
  • Tobacco use (3.0 million deaths)
  • Low physical activity (397,000 deaths)

Gesture, Font
Font
Gesture
Outerwear, Sleeve, Gesture, Happy
Glass bottle, Tableware, Drinkware, Liquid, Stemware, Barware, Gesture, Serveware
Font
Summary of risk factors

The following exploration of select risk factors provides an overview of how they contribute to CVDs in men and women by region and country, and we highlight select international policy initiatives to help mitigate them.

Physical inactivity
Countries in the North Africa and Middle East region had the lowest levels of age-standardized physical activity, while countries in the Central Europe, Eastern Europe, and Central Asia region and South Asia region had the highest levels for males and females respectively (Figure 10). The age-standardised levels of physical activity 18 among adults aged 25 years and older were higher among males compared to females in 75% of countries.

The lowest levels of physical activity among adults were observed in Iraq for males (2416.7 MET-min/week) and Malta for females (2048.7 MET-min/week). Both males and females in Kenya had the highest levels of physical activity (9 381.8 MET-min/week and 10 321.5 MET-min/week respectively).
Sodium intake
In most countries, dietary sodium intake far exceeds the recommended levels of less than 2 grams/day (Figure 11a and 11b).

The daily individual dietary sodium intake rate is highest in the Southeast Asia, East Asia, and Oceania region compared to other regions, at 6.7 grams/day for men and 5.6 grams/day for women.

For men globally, the rate is lowest in Sub-Saharan Africa (2.6 grams/day) and for women globally, the rate is lowest in the North Africa and Middle East region 2.1 grams/day.

In 92% of countries, the daily individual dietary sodium intake rate is higher among males compared to females.

There is notable variation between countries, with intake in men ranging from a low of 1.7 grams/day in Kenya to a high of 7.6 grams/day in China and from 1.7 grams/day in Turkey to 6.5 grams/day in China among women.
Alcohol consumption
Among males, levels of alcohol consumption were on average highest in the Southeast Asia, East Asia and Oceania region (mean age-standardized consumption of 23.2 grams/day) followed by the Latin America and Caribbean region (19.8 grams/ day) and the High-Income region (19.0 grams/day).

The lowest levels of alcohol consumption were found in the North Africa and Middle East region (3.18 grams/day). Across countries, daily mean consumption for males ranged from a low of 0.9 grams/day in Pakistan to a high of 61.8 grams per day in Puerto Rico.

Among females, levels of alcohol consumption were on average highest among countries in the Southeast Asia, East Asia and Oceania region (mean of 15.4 grams/day) followed by the High-Income region (12.2 grams/day) and the Latin America and Caribbean region (10.6 grams/day). Countries with the lowest levels of alcohol consumption were in in the North Africa and Middle East region (2.0 grams/day).

Across countries, daily mean consumption for females ranged from a low of 0.8 grams/day in Pakistan to a high of 36.1 grams/day in Puerto Rico (Figure 12).

In 97% of countries (198 out of 204) males consumed more alcohol per day than females. Countries with the largest differences in mean age standardized alcohol consumption include Puerto Rico (61.8 grams/day for males vs 36.1 grams/day for females), Guyana (31.0 grams/day for males vs 6.7 grams/day for females), Federated States of Micronesia (49.8 grams/day for males vs 26.3 grams/ day for females), Guam (53.0 grams/day for males vs 30.9 grams/day for females) and Chad (45.3 grams/ day for males vs 24.0 grams/day for females).

Countries where females consumed more alcohol per day than males in descending order are Nepal (16.0 grams/day for females vs 8.9 grams/day for males), Armenia (13.1 grams/day for females vs 9.2 grams/day for males), Indonesia (7.1 grams/day for females vs 4.1 grams/day for males), Liberia (21.0 grams/day for females vs 19.6 grams/day for males), United Arab Emirates (2.2 grams/day for females vs 1.4 grams/day for males), and Senegal (6.5 grams/ day for females vs 6.0 grams/day for males).
Tobacco smoking
The prevalence of tobacco smoking declined in all regions for males between 1990 and 2019, with the fastest rate of decline observed in the Latin America and Caribbean region and the slowest in the North Africa and Middle East region.

The fastest rate of decline in females was observed in the Latin America and the Caribbean region followed by the South Asia region. Prevalence of tobacco smoking for females increased in the Central Europe, Eastern Europe, and Central Asia region in the first decade of the 21st century but declined thereafter (Figure 13a and Figure 13b).

For males, age-standardized smoking prevalence was almost 50% in the Southeast Asia, East Asia, and Oceania region, with the next highest levels in the Central Europe, Eastern Europe, and Central Asia region (39.5%), and the lowest observed in the SubSaharan Africa region (17.5%) and Latin America and Caribbean region (17.1%).

For females, age-standardized smoking prevalence was highest in the High-Income region (17.6%) and Central Europe, Eastern Europe, and Central Asia region (15.5%) and lowest in the Sub-Saharan Africa region (2.9%).

For males, the five countries with highest prevalence were Timor-Leste (64.6%), Kiribati (63.8%), Federated States of Micronesia (62.2%), Indonesia (58.3%) and Armenia (55.3%) . The five with the lowest prevalence were Peru (7.3%), Nigeria (7.4%), Sao Tome and Principe (7.8%), United States Virgin Islands (8.3%) and Guinea Bissau (8.5%).

For females, the five countries with the highest prevalence were Greenland (42.3%), Nauru (40.3%), Serbia (37.8%), Federated States of Micronesia (36.4%) and Kiribati (35.1%). ).

Those with the lowest prevalence were Eritrea (0.7%), Egypt (1.1%), Morocco (1.1%), Guinea Bissau (1.1%) and Nigeria (1.2%).

In all countries except Sweden and Ireland, the agestandardised prevalence of tobacco smoking was higher in males than females.
Obesity
Obesity prevalence exceeded 20% in women in almost two-thirds of countries worldwide and exceeded the same level for men in 43% of countries (Figure 14).

The prevalence was lowest in Vietnam (1.7% in men and 2.7% in women) but reached upward of 55% in men and 60% in women in both American Samoa and Nauru.

Regionally, obesity prevalence was highest in women in the North Africa and Middle East region and the Latin America and Caribbean region, where prevalence was more than 25% in over 85% and 96% of countries, respectively.

Obesity prevalence in men was more than 25% in about half of countries in both the High-Income region and North Africa and Middle East region. Obesity prevalence was lower in South Asia where the rates in men ranged from 2% in Bangladesh to 6% in Pakistan and in women ranged from 5% in Bangladesh to 12% in Pakistan.

From 1975 to 2016, age-standardised obesity prevalence increased in all countries worldwide and by as much as 33 percentage points in women and 36 percentage points in men in Tuvalu. However, rates of increase varied substantially across countries and regions.

In the Latin America and Caribbean region, all countries experienced at least a 13 percentage points rise in obesity prevalence in women and at least a 9 percentage points rise in men. By contrast, in South Asia, obesity prevalence in all countries increased by less than 7 percentage points in men and 12 percentage points in women.
Raised blood pressure
Age-standardised prevalence of raised blood pressure was lowest in South Korea (14% in men and 8% in women) and highest in women in Niger (36%) and in men in Croatia (38%) (Figure 15).

Raised blood pressure prevalence exceeded 20% in both men and women in all countries in the Central Europe, Eastern Europe, and Central Asia region, the South Asia region, and the Sub-Saharan Africa region, and in men in the North Africa and Middle East region.

Prevalence was lowest in the High-Income region, where rates ranged from South Korea’s levels (see above) to 30% and 20% in men and women respectively in Portugal.

Raised blood pressure prevalence was less than 20% for women in all countries and for men in 21% of countries in the High-Income region. Raised blood pressure prevalence was above 22% for men and women in all countries in Sub-Saharan Africa.

From 1975 to 2015, age-standardised prevalence of raised blood pressure decreased globally by 6 percentage points in women and 5 percentage points in men.

In the High-Income region, rates declined in women by as much as 26 percentage points in Singapore, and in men by as much as 23 percentage points in New Zealand. Conversely, rates increased for many countries in the world’s poorest regions. For example, in all South Asian countries, raised blood pressure prevalence increased by more than 2 percentage points in both men and women.

Despite global reductions in prevalence, the estimated total number of adults with raised blood pressure increased from 594 million in 1975 to 1.13 billion in 2015 due to population increase and aging.
Diabetes
In China and India alone, there were over 420 million adults living with diabetes in 2014, accounting respectively for 24% and 15% of all cases globally. The prevalence was lowest in men in Burundi (4%) and in women in Switzerland (3%), and highest in American Samoa (31% in men and 33% in women).

Diabetes prevalence was high in many countries of the Southeast Asia, East Asia, and Oceania region, but there were large differences between countries within the region. Prevalence ranged from 5% in men in Timor-Leste and in women in Vietnam to 31% in men and 33% in women in American Samoa.

Diabetes prevalence was lower in the Sub-Saharan Africa region, where rates in both men and women ranged from 4% in Burundi to 10% in Gabon in men and 13% in women in South Africa.

From 1980 to 2014, the age-standardised prevalence of diabetes increased globally by 5% in men and 3% in women. Increases were seen in most countries worldwide and remained unchanged in only a few, mostly High-Income, countries.

The largest increases were in Tokelau (18% increase in women and 19% increase in men).
Lipids
Mean non-HDL ranged from 2.4 mmol/L in men and 2.6 in women in Lesotho to 4.2 mmol/L in both men and women in Malaysia and women in Tokelau in 2018.

Mean non-HDL levels were higher than 3 mmol/L in both men and women in all countries of the Central Europe, Eastern Europe, and Central Asia and Southeast Asia, East Asia and Oceania regions.

Levels were lower in the Sub-Saharan Africa region, where mean non-HDL ranged from lows in Lesotho (see above) to 3.2 mmol/L in men and 3.4 mmol/L in women in Ghana.

There was significant variability in levels and trends across regions. Non-optimal cholesterol was previously a distinct feature of High-Income countries in north-western Europe, North America, and Australasia, whereas the highest cholesterolrelated risk was now observed in middle-income countries in East and Southeast Asia, as well as some countries in Southeast Asia and central Latin America.

19 From 1980 to 2018, levels of non-HDL improved markedly in the High-Income region with declines as large as 1.7 mmol/L in men and women in Belgium. In contrast, mean non-HDL increased in both men and women in all countries in the South Asia region and most countries in the Sub-Saharan Africa region.

Some of the largest increases were by as much as 0.8 mmol/L in both women in Cambodia and in men in Tokelau. Not only did High-Income countries benefit from decreasing non-HDL cholesterol levels, but they also had higher mean HDL cholesterol than lowand middle-income countries.
Ambient air pollution
Trends in ambient air pollution show little decline over time, with the South Asia region having both the highest level of ambient particulate pollution in 2019 (5.9 times higher than in the High-Income region) and an increasing trend.

Globally, ambient particulate matter pollution ranged from 5.6 mg/m3 in Finland to 83.1 mg/m3 micrograms per cubic meter in India (Figure 18).

Countries with the highest levels of ambient particulate matter pollution are in the South Asia region (mean particulate matter = 66.2 mg/m3) followed by the North Africa and Middle East region (mean particulate matter = 44.0 mg/m3) and SubSaharan Africa region (mean particulate matter = 39.5 mg/m3).

Countries with the lowest levels are in the High-Income region (mean particulate matter = 11.2 mg/m3) followed by the Southeast Asia, East Asia, and Oceania region (mean particulate matter = 15.2 mg/m3).
Comparative levels of risk factors by country and region

For each of the previously reported cardiovascular risk factors, we ordered countries from the highest to the lowest level.

In the Appendix, we can see the quintile into which each country falls for each risk factor. This can help policymakers and stakeholders identify the risk factors that are particularly high in their context and define priorities for action.

Central Europe, Eastern Europe and Central Asia
In the Central Europe, Eastern Europe, and Central Asia region, most countries have high levels of sodium intake, raised blood pressure and non-HDL cholesterol in men, and high levels of sodium intake and tobacco smoking in women. Within the region, countries in Central and Eastern Europe generally have higher levels of risk factors overall than countries in Central Asia.
High-Income
In the High-Income region, most countries are characterised by high-levels of behavioural risk factors, namely high levels of sodium and alcohol consumption, high levels of tobacco smoking, and low physical activity. They also have high levels of non-HDL cholesterol in both sexes, and high obesity levels in men.
Latin America and Caribbean
The Latin America and Caribbean region is more heterogeneous compared to other regions, though low physical activity is a significant risk factor across many countries of the region. Generally, Caribbean countries have higher risk factor levels than other countries in the region.
North Africa and Middle East
The North Africa and Middle East region is characterised by high levels of metabolic risk factors, especially diabetes and obesity. Air pollution and physical activity are also significant risk factors in this region. In general, Middle Eastern countries have higher risk factor levels than those in North Africa.
South Asia
Air pollution levels are high in all countries in South Asia. Sodium intake, raised blood pressure and diabetes are also high in both sexes.
Southeast Asia, East Asia and Oceania
In the Southeast Asia, East Asia and Oceania region, countries in Oceania have high levels of diabetes, obesity, tobacco smoking, and low levels of physical activity. They also have some of the highest levels of non-HDL cholesterol in women. All countries in Southeast Asia and East Asia have high levels of sodium intake and non-HDL cholesterol.
Sub-Saharan Africa
In the Sub-Saharan Africa region, most countries have higher levels of raised blood pressure. Air pollution levels are also high across the region, and particularly in countries in the Sahel. Generally, countries in southern Sub-Saharan Africa have the highest risk factor levels in the region.

Key Recommendations

Countries and other relevant stakeholders should continue efforts to improve data for CVDs and their risk factors, particularly in LMICs where data gaps exist.

This will help to understand why certain populations are at higher risk for certain CVDs.

Countries should ensure that their health expenditure as a percentage of GDP is at least 5%, in line with recommendations from the World Health Organization.

Countries should implement policies to combat CVDs, guided by the burden of disease and predominant risk factors, and ensure that their implementation is adequately resourced and monitored for progress.

Countries should prioritise coverage of interventions for the prevention and management of CVDs in Universal Health Coverage (UHC) benefit packages to help minimize out-of-pocket expenditure.

Lessons learned in improving CVD prevention, management, and improved access to care and therapies need to be implemented across all regions to address inequities and the uneven progress in CVD mortality declines.

Methodology and data sources

  • The first World Heart Report was made possible through support from the Novartis Foundation. For overall burden and trends in CVD mortality, estimates from the Global Burden of Disease from 1990 to 2019 were used, as this is the last year for which estimates are available at the level of disaggregation needed for the report.
  • The report occasionally references 2021 data on global disease burden, though more detailed disaggregation is not available for that year. In addition to the Global Burden of Disease Study, the main data sources used are the NCD Risk Factor Collaboration, the NCD Countdown 2030 initiative, WHO and the World Bank. one.